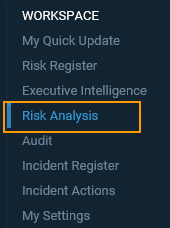
Risk Analysis

This area provides a graphical snapshot of risks against your hierarchies and allows drill down for more information and analysis of changes in risk ratings over time.
It consists of three tabs: Overview, Heat map and Charts. Details of each tab is based on the filters and the selected organization hierarchy level.
You may drill up and down through the Organisation Hierarchy by clicking on the ‘Organisation’ side menu, and using the arrows to drill up and down to find the level of the organisation that you want to view the risks for:
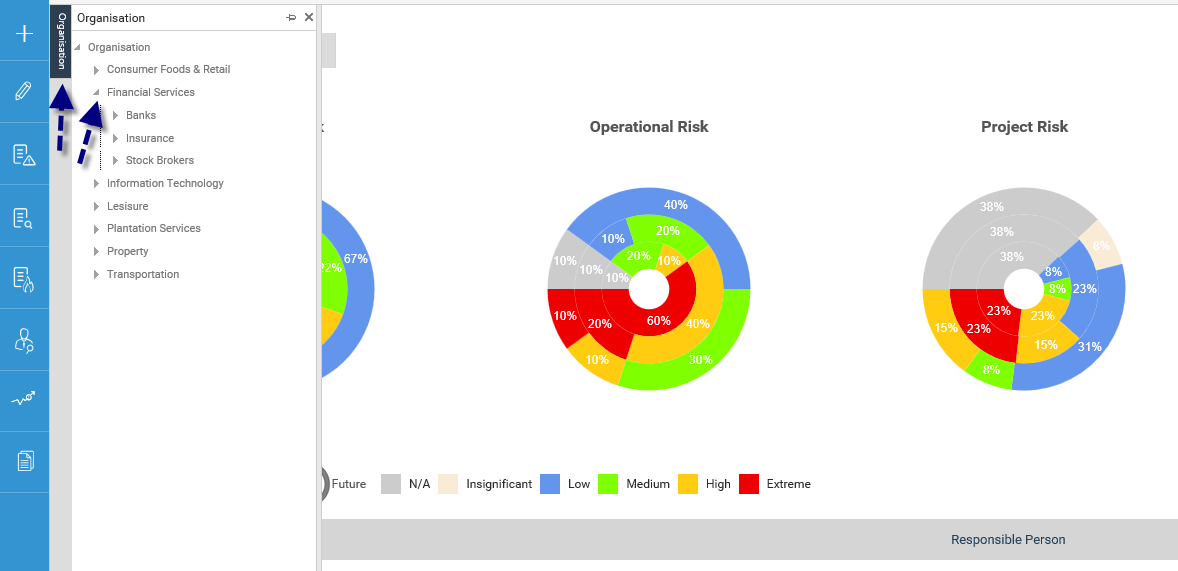
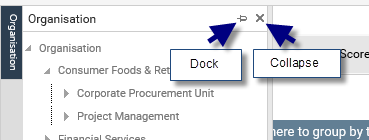
Once you have clicked on the level of the hierarchy that you want to view, you can either dock the side menu out or collapse this (hide it) from the screen. The page will refresh and display Risks specifically linked to that level of the hierarchy.
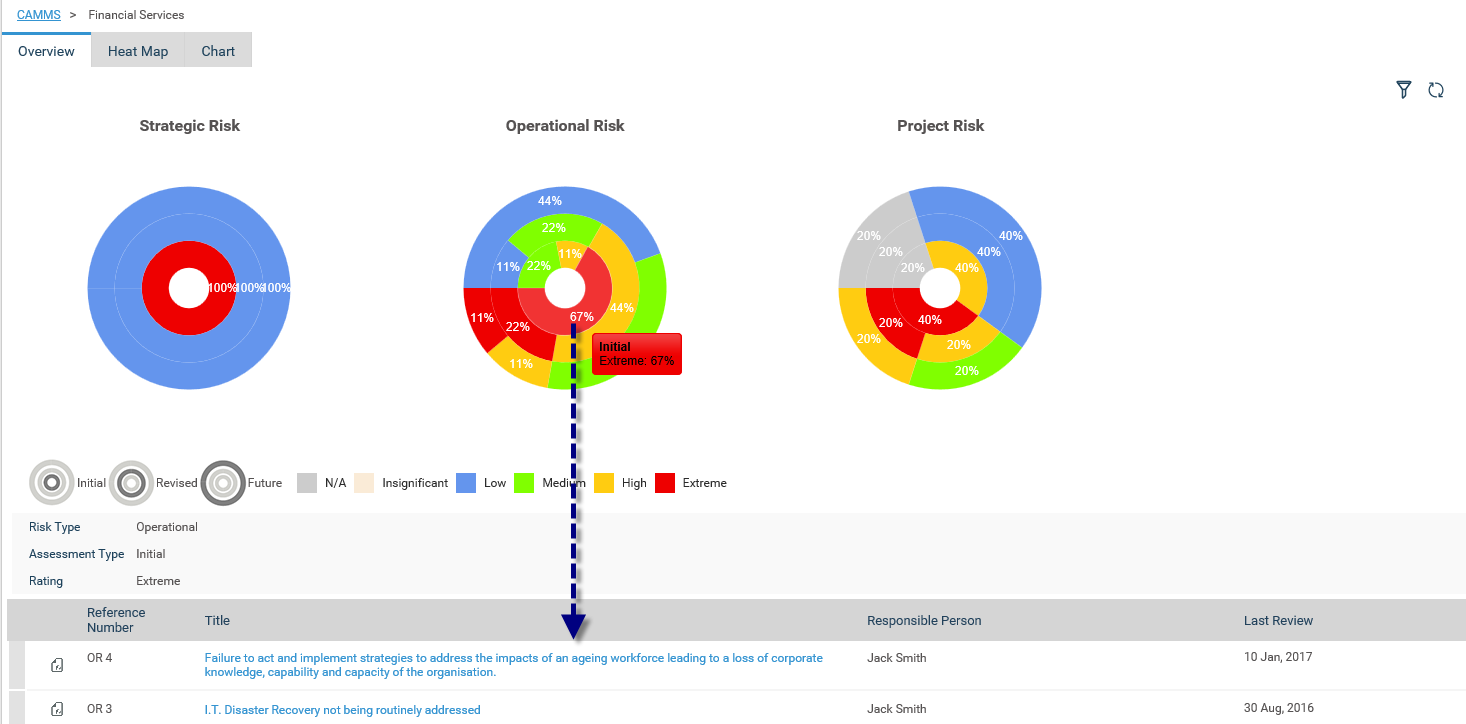
The level you have selected will be displayed in the breadcrumbs at the top of the page:

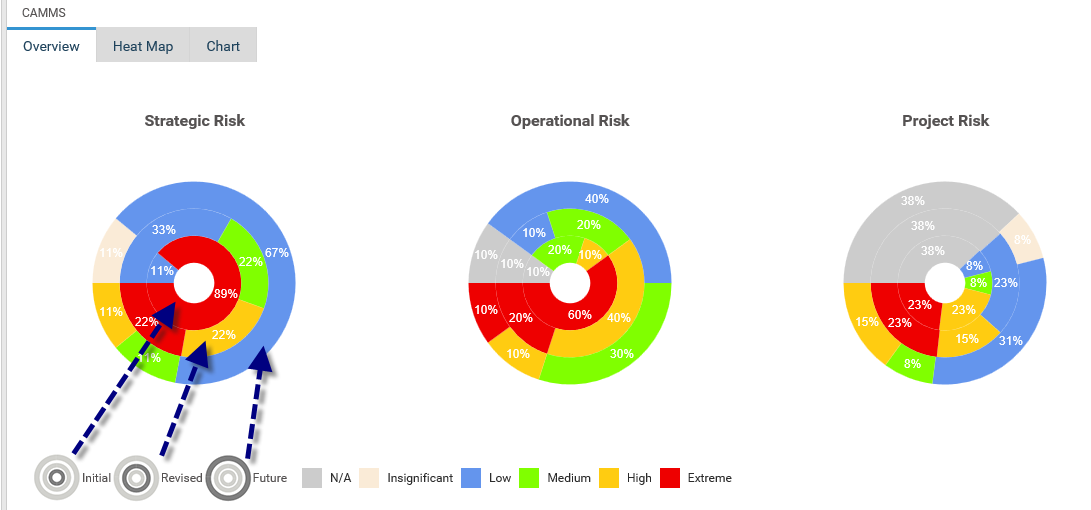
The way that these donut charts work is by viewing the initial risks percentages in the middle bar, and then extending to the Current and Future as the graph extends outwards. The basic logic is that your Extreme and High risks should be reducing from the middle – outwards if they are being controlled properly.
To filter, you can click on the filter icon  on the top right hand corner of the section.
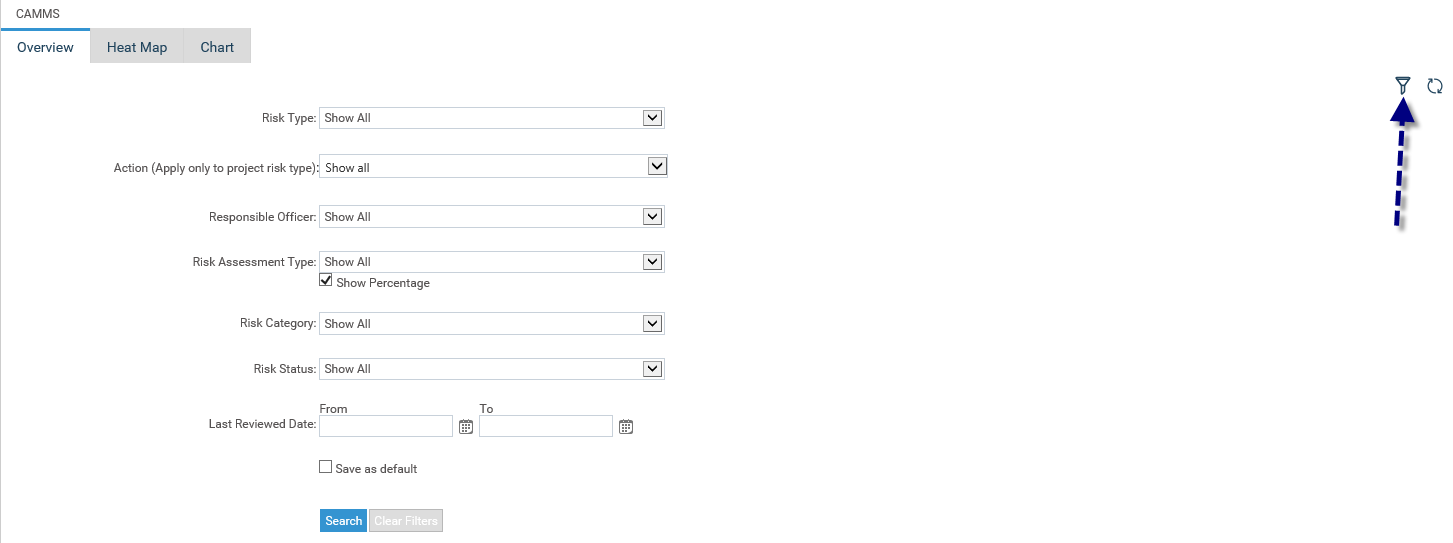
The following filters are available:
|
Filter |
Description |
|
Risk Type |
Risks will be filtered based on the selected Strategic, Operational and Project type. Default ‘Show All'. |
|
Action (apply only to project risk type) |
Risks will be filtered by the Action name (only applicable to Project risks if they are present) |
|
Responsible officer |
Staff drop-down included. Risks where selected staff is the responsible person will be checked. Default ‘Show All'. |
|
Risk Assessment Type |
Initial, Current and Future Risk filter. Risks will be filtered for the selected assessment. Default ‘Show All’. |
|
Risk Category |
Risks will be filtered based on the selected category. Default ‘Show All’. |
|
Show Percentage |
Information in the pie chart is shown in percentages when the check-box is ticked. When un-tick number of risks are displayed (default). |
|
Risk Status |
Filter the risks by risk status – Active, Inactive and Show all. Default ‘Show All’. |
|
Last Reviewed Date |
Filter Risks by a time period that it has been last reviewed. Use the calendar icons to select a time FROM and TO. |
|
Save search |
User can save search options individual by selecting the filters and ticking ‘Save search’ check-box before clicking ‘search’ button. |
|
Search |
This button is clicked to initiate the search. |
|
Clear search |
Pressing this button will clear all the selected filters and set to default. |
Copyright © 2014-2015 CAMMS Online Help. All rights reserved.
Last revised: September 23, 2018